3 Levels of Unpacking For Newbies. Part #1: Conceptually Unpack UPX
Introduction
This is a 3 parts series attempting to teach beginners how to unpack malware. As a beginner myself, I hope my thinking process will be more relatable to others. If I make mistakes in this blog, please feel free to give me feedback.
Manual unpacking can be a very intimidating task for starters. Without knowing the tips and tricks, the process can take days and weeks, or you may never find the answers. I intend to not only show you some must-know tricks but also explain why they work or don't work. These articles will be similar to a lab when I perform a standard old-school unpacking process and explain the details along the way.
Part 1: UPX Packer - The "Hello World" of Reverse Engineering
Just like every computer scientist starts out with the "Hello World" program, every reverse engineer learns how to unpack UPX at some point. You can download UPX here. Basically,"upx filename" will pack a file, and "upx -d filename" will unpack it.
Unlike a "Hello World" program, knowing how to manually unpack UPX has some real-world values:
- UPX is very popular due to its compression efficiency.
- Most of UPX packed samples in the wild has modified versions of UPX that you can't unpack with "upx -d."
Today we will look at 2 samples:
- Sample1: An random .exe file that I packed with "upx filename"
- Sample2: A real malware that I searched on VirusTotal with keywords "tag:upx".
c04fadfc24d3ce8cdcdc9f3cde57df33462d50e1c1966552a44faae4c76e7e5e

Tools:
- PE-bear (My favorite PE Header tool)
- x64dbg (A good looking Ollydbg).
- IDA Free Version
- HxD
First step: PE-bear
In a professional environment, most malware analysts start their process by running the sample in a sandbox and automation tools. When you get your sample from VirusTotal or MalShare, there is already a certain level of automation performed:

It is possible to get away with not analyzing the PE structure manually, just like how some people would use a calculator to do (39*25). Fortunately, similar to do (40*25 - 25) in your head, PE structure is pretty simple to learn.
If you open a file in HxD, at offset 0, there is a WORD or DWORD magic flag that tells Windows how to run a file. This is the best way to identify a file's format.

Memorizing the "MZ" or "0x5A4D" is a must as it will help you recognize when a PE is unpacked, loaded into memory, or write to disk.
Let's analyze 3 samples in PE-Bear:
example.exe
Sample1:

Sample 2:

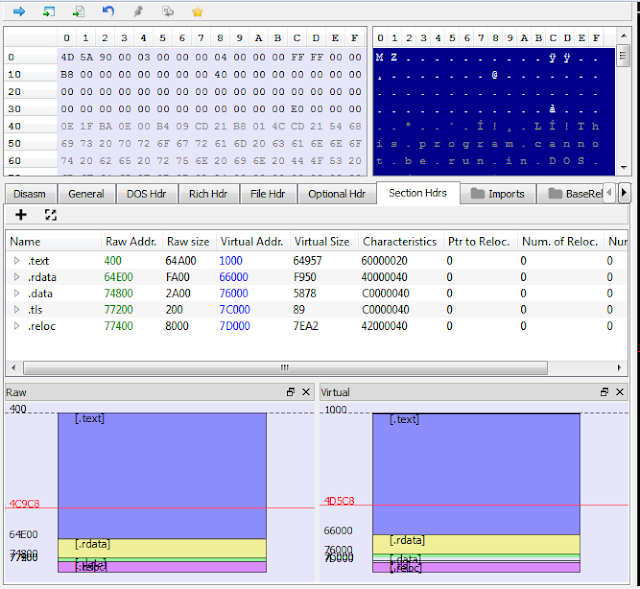
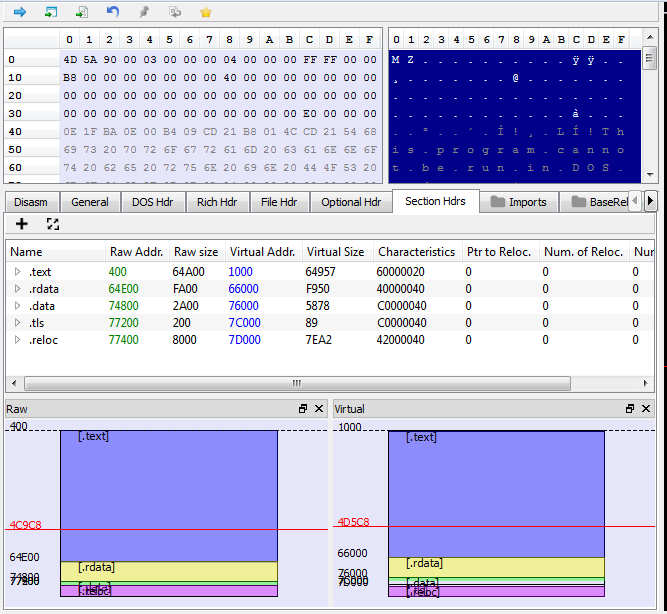
1. Raw Address vs. Relative Virtual Address
It is essential to have a clear understanding of these 2 concepts. Raw Address (RA) can be understood as a file offset relative to the beginning of the file. Since all the files start at 0, Raw Address is the address where data located within the file. Just to fuck with you, your hard drive can be opened as a giant file. On the other hand, when a PE is loaded in memory, the Relative Virtual Address is used to offset data within the memory region. The starting address of the memory region is called Image Base or base address. Relative Virtual Address + Image Base is the address where the data located in memory. Image Base is specified in the Optional Header at RA 0x134 and often has a default value of 400000. However, if that address space is occupied, Windows will pick an alternate address space (known as rebasing). That's why Image Base is often referred to as the preferred base address. By default, IDA will use the preferred base address; and if you turn off ASLR, x64dbg will do the same.
From looking at the "Raw vs. Virtual" graph patterns of 3 files, we can see UPX packer compress standard sections (.text, .rdata...) into 3 new sections and modified their names. The difference between Raw and Virtual memory distribution, as well as the "0 Raw Size" of the first section, is a clear indicator that a sample is packed. The OEP, specified at RA 0x128 in Optional Header, is located at the very end of the file (the red line). The reason is UPX compresses the original file, then adds the unpacking stub at the end. When you run a packed file, the unpacking stub will start first, recover the original file, then transfer control back to the OG EP.
2. Obfuscated Import Address Table
Just like #include in C or #import in Python, Import Address Table (IAT) tells the Windows upfront what libraries and functions needed to run the program. The relative virtual address of IAT is specified in Optional Header at 0x180. IDA uses IAT to label the API calls. The problem is there are ways to load library and functions at run time (runtime linking), so it is not necessary to specify a complete IAT. When you counter an empty IAT, there could be 2 scenarios:
1.) The original PE's IAT is packed. You need to unpack and use tools to rebuild the Import Table.
2.) Runtime linking or some people call it "dynamically resolve API". Debugging/scripting will be required (more in later parts of the series).
Both samples belong to scenarios 1, where the IAT was obfuscated by UPX. I will show you how to rebuild import tables using x64dbg.
3. Strange DOS Stub and no Rich Header in Sample 2
Normally, DOS Stub starts at 0x40 (specified by 0x18 in DOS Header), and at 0x4E is the famous "This program cannot be run in DOS mode" string. Right after the DOS Stub, is the undocumented Rich Header, which may contain info about the compiler and libraries used to build the PE. PE-bear is one of few PE tools that actually decrypt and display Rich Header info. As you can see, Sample2 has a different DOS stub and no Rich Header. As for how are they modified, I have no idea :)
Second step: x32dbg
No empathy for packers
The goal of unpacking is to retrieve the original PE file with a minimum amount of time and effort. That's why the art of unpacking is about recognizing the anti-analysis techniques the packer uses, and bypass them with our own tricks. Unless the packer itself is your target of analysis, you should bypass them whenever you can.Navigation Band and Graph overview
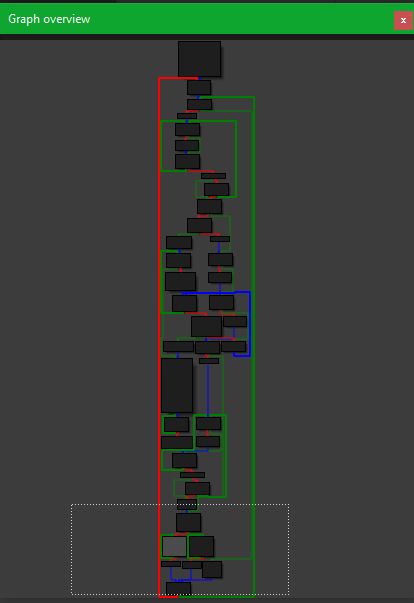
It is good habits to look at the Navigation Band when you first load the file into IDA as well utilize graph view in both IDA and x32dbg. You can also customize the IDA graph view to include address or opcodes. Turn to graph view (Spacebar), then open Windows tab -> Options-> Check Line prefixes or Set Number of opcodes to 6. For our packed examples, the Navigation Band tells us that only 1 function locates at the very end is recognized. While the ugly graph shows us the existence of obscure flow control techniques.
Where to set breakpoints?
These assembly codes have a lot of noises that won't tell you much about their functionalities. The best approach is to quickly scan through for anything suspicious instead of trying to understand the logic. It is time to pull out the debugger and ask yourself where should the breakpoints be set?
This is where experience and tutorials come in. There is an interesting instruction: pushad (at EP), and somewhere popad. I know they are interesting because I read somewhere that they are. pusha/pushad and popa/popad are special because compilers rarely produce them. Their appearance means someone manually added assembly codes. Besides, pusha and popa are often used in shellcode to save and restore the state of registers. If we keep scanning through the code, we will find some call instructions are obscured through using registers, like "call ebp". More often or not, it may be worth setting breakpoints to figure out where the calls are gonna jump to.
Let's Dew it
First, open x32dbg and make sure "Break on: Entry Breakpoint" is checked in Options-> Preferences. Open the packed samples, press F9 until you hit the breakpoint on Entry Point. Now we are at pushad, step over it, and set Hardware BreakPoint on Access at one of the stack locations contain a register value.

The reason is that we want the program to stop at popad, where the registers are restored. Our hope is that between the pushad/popad, the unpacking process has happened, and now the packer stub is ready to transfer control to the original program. In this scenario, this trick will work since UPX is not really designed to fight against reverse engineers. On the contrary, packer writers love to play mind games, and you find a lot of garbage pushad/popad in other packers.
If you are unclear why Hardware BreakPoint is used, here is an extremely short explanation (please read more on this topic). Software Breakpoint replaces the first byte of the instruction, where it is set, with an opcode 0xCC, which stands for instruction INT 3 (interrupt 3). The breakpoint will be hit when the interruption instruction is executed. Meanwhile, Hardware Breakpoint is set on an address and triggered when the data from that address is accessed. We used Hardware Breakpoint in the example because we know popad will use the same stack address to restore the register value.
Tail Jump
Tail jump (different from tail call) is the instruction that transfers execution to the OEP when the unpack stub finishes. A tail jump could be a ret, call, condition jump, or an unconditional jump instruction as long as it moves the EIP to the OEP. I wonder if tail jump also applies to the instruction that transfers control to shellcode. If it's up to me, I would just call it THE JUMP, or TRUMP in short. Anyway, tail jump has the following characteristics.

Taking the jump on Sample1 and open graph view, it looks like a start function:

Rebuild Imports and Dump with Scylla
If the original program has a legit IAT, at this point it should be restored, otherwise, the program can't run. One way to test it is to open Scylla in x32dbg->Plugins.

Pressing "IAT Autosearch" and "Get Imports" buttons, the retrieved libraries look pretty legit. Next step is to "Dump" + "Fix Dump" to get a _scy.exe file. Congratulation, that is our unpacked sample.

The reason is that we want the program to stop at popad, where the registers are restored. Our hope is that between the pushad/popad, the unpacking process has happened, and now the packer stub is ready to transfer control to the original program. In this scenario, this trick will work since UPX is not really designed to fight against reverse engineers. On the contrary, packer writers love to play mind games, and you find a lot of garbage pushad/popad in other packers.
If you are unclear why Hardware BreakPoint is used, here is an extremely short explanation (please read more on this topic). Software Breakpoint replaces the first byte of the instruction, where it is set, with an opcode 0xCC, which stands for instruction INT 3 (interrupt 3). The breakpoint will be hit when the interruption instruction is executed. Meanwhile, Hardware Breakpoint is set on an address and triggered when the data from that address is accessed. We used Hardware Breakpoint in the example because we know popad will use the same stack address to restore the register value.
Tail Jump
Tail jump (different from tail call) is the instruction that transfers execution to the OEP when the unpack stub finishes. A tail jump could be a ret, call, condition jump, or an unconditional jump instruction as long as it moves the EIP to the OEP. I wonder if tail jump also applies to the instruction that transfers control to shellcode. If it's up to me, I would just call it THE JUMP, or TRUMP in short. Anyway, tail jump has the following characteristics.
- Go the address far far away
- Go to a prologue, or inside of a function
- The assembly codes underneath the tail jump look like garbage

Taking the jump on Sample1 and open graph view, it looks like a start function:

Rebuild Imports and Dump with Scylla
If the original program has a legit IAT, at this point it should be restored, otherwise, the program can't run. One way to test it is to open Scylla in x32dbg->Plugins.

Pressing "IAT Autosearch" and "Get Imports" buttons, the retrieved libraries look pretty legit. Next step is to "Dump" + "Fix Dump" to get a _scy.exe file. Congratulation, that is our unpacked sample.
Exercise - Sample2
Turn out the same jump in Sample2 is not exactly our tail jump, but it will get you close to the right one. "IAT Autosearch" can also be used to test whether we are in the original PE or not. As an exercise, please try to unpack it.

Could anyone please help in unpacking sample2 ?
ReplyDelete