3 Levels of Unpacking For Newbies. Part #2: Stubbornly Unpack VB6 RunPE
This is the second part of the 3 parts series attempt to teach beginners the fundamental concepts and basic techniques for unpacking. Since I am a beginner myself, I hope my way of thinking would be more relatable to others out there.
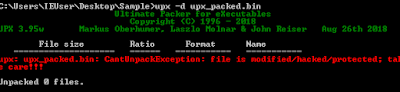
For Part#1, in order to recognize and unpack UPX, we learned a little bit about PE Structure, RVA, IAT, run-time linking, software breakpoint vs hardware breakpoint, tail jump, and using Scylla to rebuild IAT. We also learn the trick of setting hardware-breakpoint on the stack when encountering pusha/pushad so that the execution will stop at the corresponding popa/popad. Sadly, as far as I know, this trick won't work on more complicated packers. However, today we will learn a technique that can apply to the majority of packers: setting breakpoints on Windows API, or some people call it: API hooking

I also defined them as functions for a better view. The AddVectoredExeceptionHandler may explain the reason why an exception is encountered in the second tutorial. At this point, I can only think of debugging these API calls to see what's up.


Oh shit, now you gotta do that 20 more times to reveal all the APIs. At this point, using IDA scripting is a good way to avoid tedious work. But for the sake of a beginner's guide, we eliminate that option and resolve everything by hand. You may wonder why I renamed all the functions similar to the string beneath them. From debugging, I observe that most of the functions use DllFunctionCall to resolve the APIs specified by the strings beneath their call locations. Another odd thing is these functions end with a jump instruction instead of a traditional return. This technique makes it difficult to track the flow of execution.
After fixing up all the strings, here are some interesting details that we can use as pivots for our next debugging session:
For Part#1, in order to recognize and unpack UPX, we learned a little bit about PE Structure, RVA, IAT, run-time linking, software breakpoint vs hardware breakpoint, tail jump, and using Scylla to rebuild IAT. We also learn the trick of setting hardware-breakpoint on the stack when encountering pusha/pushad so that the execution will stop at the corresponding popa/popad. Sadly, as far as I know, this trick won't work on more complicated packers. However, today we will learn a technique that can apply to the majority of packers: setting breakpoints on Windows API, or some people call it: API hooking
1. Introduction
In order to interact with Windows OS, every software has to call Windows APIs. Tho, not all APIs are created equally. Choosing the right APIs to start your static and dynamic analysis can get you to or close to the malware's core functionalities or important data. By pivoting on the right APIs, anti-analysis techniques such as junk codes, obfuscated control flow, calculating the execution duration can be bypassed. Here are some ways to collect and pick out important APIs:
- Load-time linking: use the Imports View in IDA, pick out important functions and check their xrefs
- Run-time linking: run the sample in a sandbox, look at the API calls history in reverse chronological order. Most of APIs from the early run time won't give us useful info.
- If access to an automated sandbox is not available, you can run the sample in your VM and use Process Hacker to observe process injection behaviors. Or use TinyTracer
First, let's take a look at this awesome VB5 unpacking tutorial
I know the readers are probably frustrated that I include an unpacking tutorial inside an unpacking tutorial. But this article is just too good not to read while explaining process injection again is just plain redundant.
Now, let's take a look at today's sample...coming from another tutorial on Youtube. I highly recommend checking out OALabs:
This is actually my first ever unpacking tutorial video. I decided to revisit this sample because I thought there are a lot of unexplained details that could be educational to beginners. Moreover, this would make a great example of how impactful pivoting right APIs can be. First, here is a breakdown of the video:
- Make an educated guess to set a breakpoint on CreateProcessInternalW
- Run pass an exception.
- Make an educated guess to search for PE header after hitting the breakpoint
- Dump and trim out the unpacked sample.
The interesting part is if you follow the first tutorial, setting breakpoints on these APIs won't work:
- CreateProcessW
- NtUnmapViewOfSection
- NtWriteVirtualMemory
2. VB6 RunPE
The packer we are dealing with is a RunPE variant written in VB6. RunPE is a very well-known technique used by malware writers. It allows hiding a malicious PE in a host process, then the malicious PE is executed through process injection. You can find tons of RunPE implementations on Github. As you see, both tutorials target RunPE behaviors to unpack the sample. An alternative is to analyze the VB6 unpacking code, which would be a huge pain in the ass.
Visual Basic is an object and event-driven based langue, that went obsolete in 2008 (VB 6.0 as the latest version). When you write a program in VB6, you have two options of compiling them into native code or pseudocode code (p-code). When running, p-codes requires a virtual machine to translate them into native code. This VM is implemented in MSVBVM60.DLL, which is the only library required to run our sample. To obtain handles to other libraries, VBVM uses DllFunctionCall which is an equivalent of LoadLibrabry + GetProcAddress.
Due to how poorly p-code translation is documented, this tool is the only VB decompiler that I know. Unfortunately, this decompiler only works with non-obfuscated code. Therefore, we have to try a different approach to analyze our sample.
3. Static Analysis
From the first tutorial, we know the address of the VB header is passed to ThunRTMain. There is an amazing IDC script that helps us view the VB format better. After running the script, we got something like this:

Unlike the first tutorial, the _lpSubMain is set to 0, which means the order of execution will follow the order of how Windows Forms (similar to a GUI component) are loaded. Because of how obfuscated they are, we won't be able to make much sense of these Windows Forms. The next step is trying our luck with xrefs to DllFunctionCall, which lead us to some interesting strings:


So IDA faces some problems disassemble this part of the code. By using the "Data"(D)/"Undefine"(U) and "Code" (C), we can fix them up to something like this:


4. Debug Results
So I set a breakpoint near the end of DllFunctionCall as fail-safe and some breakpoints at "jump eax" of interesting APIs. To my surprise, these APIs are just parts of the anti-analysis techniques. They are called multiple times with invalid parameters, trigger some exception handlers in MSVBVM60.DLL, and returned to the main executable at an address that I can't get a hold of. In addition, CreateProcessWithLogonW was never called. Tho after running pass the exception triggered by AddVectoredExeceptionHandler, my breakpoint on DllFunctionCall got hit on an API that we have not seen in the previous static analysis. Returning from DllFunction, the EIP came out into a new virtual memory space. The next natural step is to dump it out from Memory Map tab and take a look in IDA
5. More Static Analysis
The new dump memory looks like a highly obfuscated shellcode. Both anti-disassembly and obfuscated flow-control techniques are used. Before we go into how to defeat them, first we need to understand the nature of a disassembler.
Linear vs Flow-oriented Disassembly
The way the linear-disassembly method works is similar to how we normally read. It starts at the beginning of the section, disassembles one instruction at a time until it reaches the end of the section. "Linear disassembly uses the size of the disassembled instruction to determine which byte to disassemble next, without regard for flow-control instructions" (Practical Malware Analysis).
On the other hand, flow-oriented disassembly focuses on identifying which area contains instruction vs. data by examining branching and call instructions. Most of the anti-disassembling techniques are built around manipulating these instructions to trick IDA into thinking data as code and otherwise. When you see weird instructions in IDA, you may want to consider the possibility of anti-disassembly techniques.
First, we need to uncheck the analysis option in Options->General->Analysis so that IDA won't interfere with our corrections to the code. If you look at the String Windows you will find a "GetTickCount" appears in the middle of weird-ass instructions. Next, I set the Number of opcode bytes in Options->General to 6 to see how are these opcodes got translated.

A strange pattern appears: a bunch of weirdo instructions is sandwiched by call instructions. Indeed, when turning them into data, we got some API names.

Oh shit, now you gotta do that 20 more times to reveal all the APIs. At this point, using IDA scripting is a good way to avoid tedious work. But for the sake of a beginner's guide, we eliminate that option and resolve everything by hand. You may wonder why I renamed all the functions similar to the string beneath them. From debugging, I observe that most of the functions use DllFunctionCall to resolve the APIs specified by the strings beneath their call locations. Another odd thing is these functions end with a jump instruction instead of a traditional return. This technique makes it difficult to track the flow of execution.
After fixing up all the strings, here are some interesting details that we can use as pivots for our next debugging session:
- APIs: CreateProcessInternalW, NtResumeThread, UnmapViewOfFile, NtGetContextThread, NtSetContextThread, VirtualAllocEx, ShellExecuteW, NtWriteVirtualMemory.
- VB Script at offset 0x1B60 :
myKey = "HKCU\Software\Microsoft\Windows\CurrentVersion\Run\"
Vbs = ""
Set WshShell = CreateObject("WScript.Shell");
If WScript.Arguments.Count = 0 Then;
    On Error Resume Next;
    J = Now;
    J = Now;
    J = Now;
    J = Now;
    EC = second(now)
    WScript.Sleep(6016);
    DCA = second(now)
    If Abs(DCA-EC) => 6 then WshShell.RegWrite myKey,Vbs & " -VC","REG_SZ";
    end if
    WScript.Quit
end if
WshShell.Run """
5. Debug Results - Part 2
The anti-debugging techniques employed in the shellcode are already covered in the first tutorial. Therefore, I won't mention them here. When debugging., remember to take snapshots in case you need to rerun the same section with different breakpoints.
In the beginning, the shellcode links many APIs but only calls a few of them. After taking the jump at 0x1B2, a huge junk of memory (we will call it vmem1) with the size of 0x1C1FF000 was allocated using VirtualAllocEx . The shellcodes continue to link more APIs until the second call to VirtualAllocEx was made. This time allocates a memory size of 0x25C8 (vmem2).
Following the read/write behaviors in both memory regions lead me to a routine at 0x15B6. This function writes some undecrypted data to vmem1. Specifically, instructions at 0x158F and 0x1592 transferred data from the main PE starting at 0x491554 to vmem1 starting at RVA 0x1000. The debugging continues until a hardware breakpoint on vmem1 is hit again inside the routine at 0x16B8:

This looks pretty much like a decryption algorithm. After the decrypting routine finishes, we are left with something looks like a PE file at RVA 0x6108. Yes, this is the unpacked sample found in the second tutorial. But we are not done yet, we still need to find the answer to why breakpoints on some APIs mentioned in the first tutorial won't get hit.
CreateProcessInternalW was called at 0xD1C inside a function at 0xC6F. The following APIs called are NtGetContextThread (0xD3C) -> NtSetContextThread (0xD6C) -> NtResumeThread (0xD8E). To my surprise, none of the breakpoints I set on UnmapViewofFile, NtUnmapViewOfSection, NtWriteProcessMemory, NtWriteVirtualMemory were hit. The VB Script and ShellExecuteW were also not seen. My next step is to analyze the PPROCESS_INFORMATION and CONTEXT Structures for clues. The address of these structures are located in the beginning of vmem1:

In this example, vmem1 base address is 0x2640000. The OEP of the child process is at 0x492234, which is the p-code section within the original PE .And this is where I hit a dead end, I can't conceptually explain how process injection happens with only using CreateProcessInternalW NtGetContextThread -> NtSetContextThread -> NtResumeThread.
If anyone has an explanation, please let me know.
Comments
Post a Comment